

Understanding how you compare to your peers is important and being able to do this on demand makes this EASY! That's where the Peer Score Analysis report comes in. Below outlines the key features and the data you can find within.
"While it's tempting to compare oneself to others, it's important to focus on personal growth and improvement rather than external validation. Additionally, experience scores may not always accurately reflect the depth and breadth of an individual's experiences, as they may not account for qualitative aspects such as personal growth, resilience, and adaptability. Ultimately, it's more important to focus on individual progress and to view the experiences of others as opportunities for learning and growth rather than as a benchmark for comparison."
- MXP Client Success Team
Peer Score Analysis
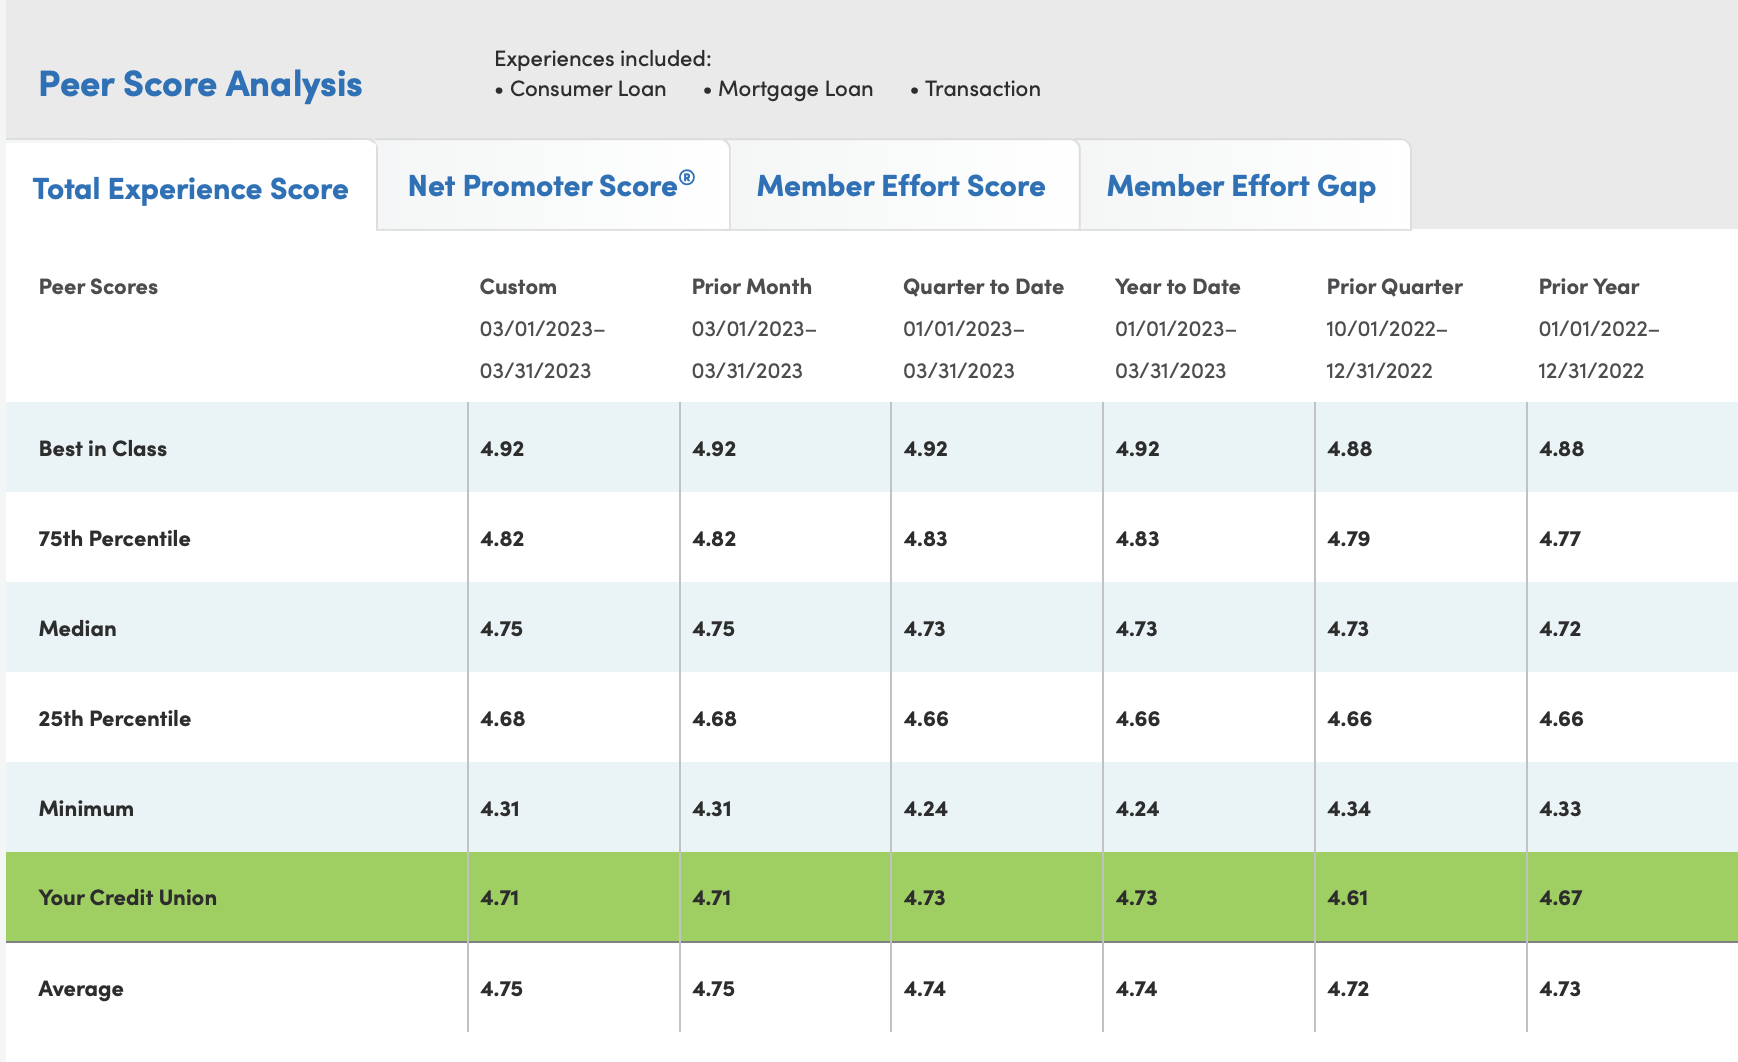
- Custom - based on dates originally filtered by
- Prior Month - Last Completed Month
- Quarter to Date - Quarter to Date with Only Fully Completed Months
- Year to Date - All Fully Completed Months to Date
- Prior Quarter - Last Completed Full Quarter
- Prior Year - Last Completed Full Year
Here are the steps to run the report:
1. Select Peer Score Report from the report drop-down.
(Tip: If you select only the survey experiences you wish to combine, this will reduce load times as the report loads in all of the experiences you are currently running.)

2. After report loads, scroll down and you should see the table. Each tab represents each major KPI.

3. If you'd like to add more experiences to your report, simply use the filters at the top of the report.
(Tip: Once you have clicked on the Adjust Data Filters tab, the dropdown menu will allow you to pick and choose what filters to apply. You MUST click the "Apply Filters" button in order for your filter selection(s) to take effect.)


4. Don't forget about the Visualizations at the bottom just under the table!

