

Did you know you can create your own visualizations to take your insights even further with PowerXP? If you've ever wondered what the "Storytelling" button was, this is the place to be!
PowerXP's built-in "Storytelling" feature allows users to create their own "slide decks" for internal team sharing.
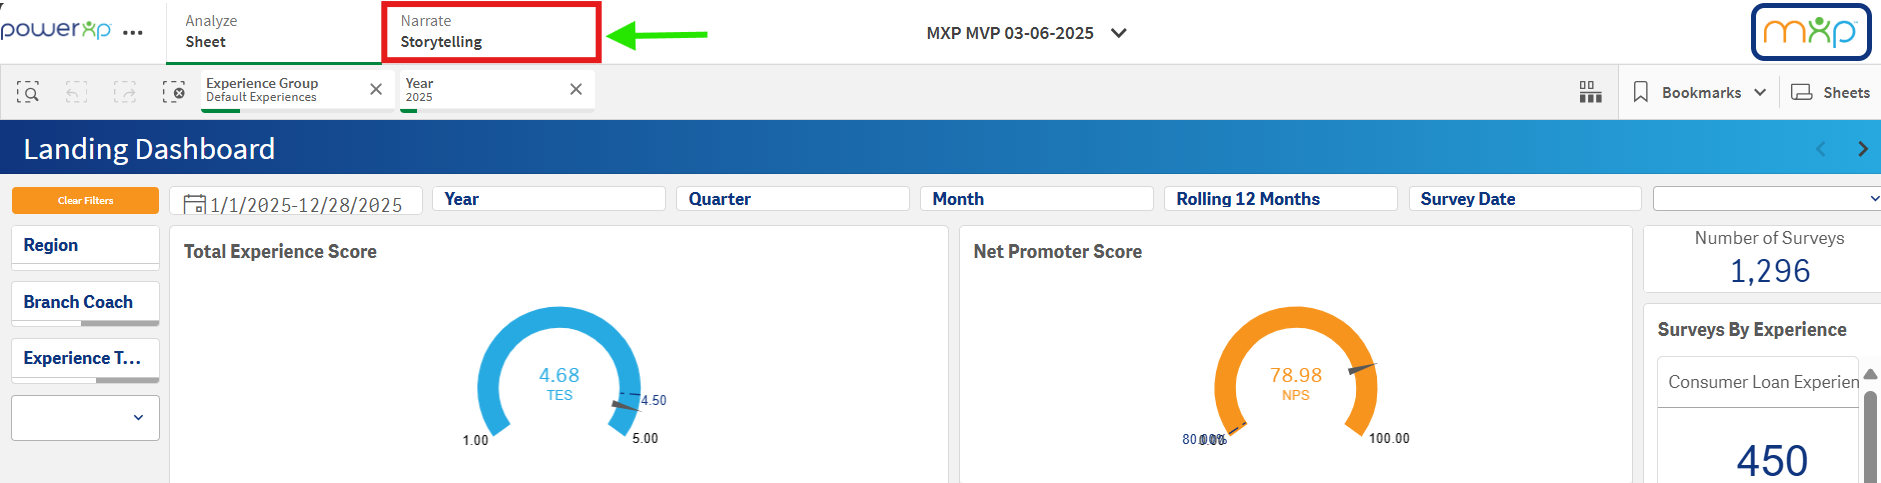
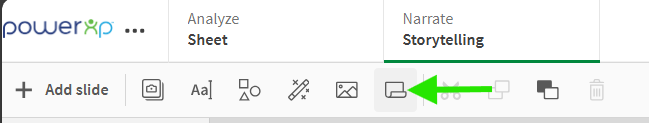
To get started, click here on the Narrate: Storytelling section in the upper-left hand corner of your screen, next to the Analyze: Sheet section that should already be highlighted (selected) once you've logged into PowerXP.
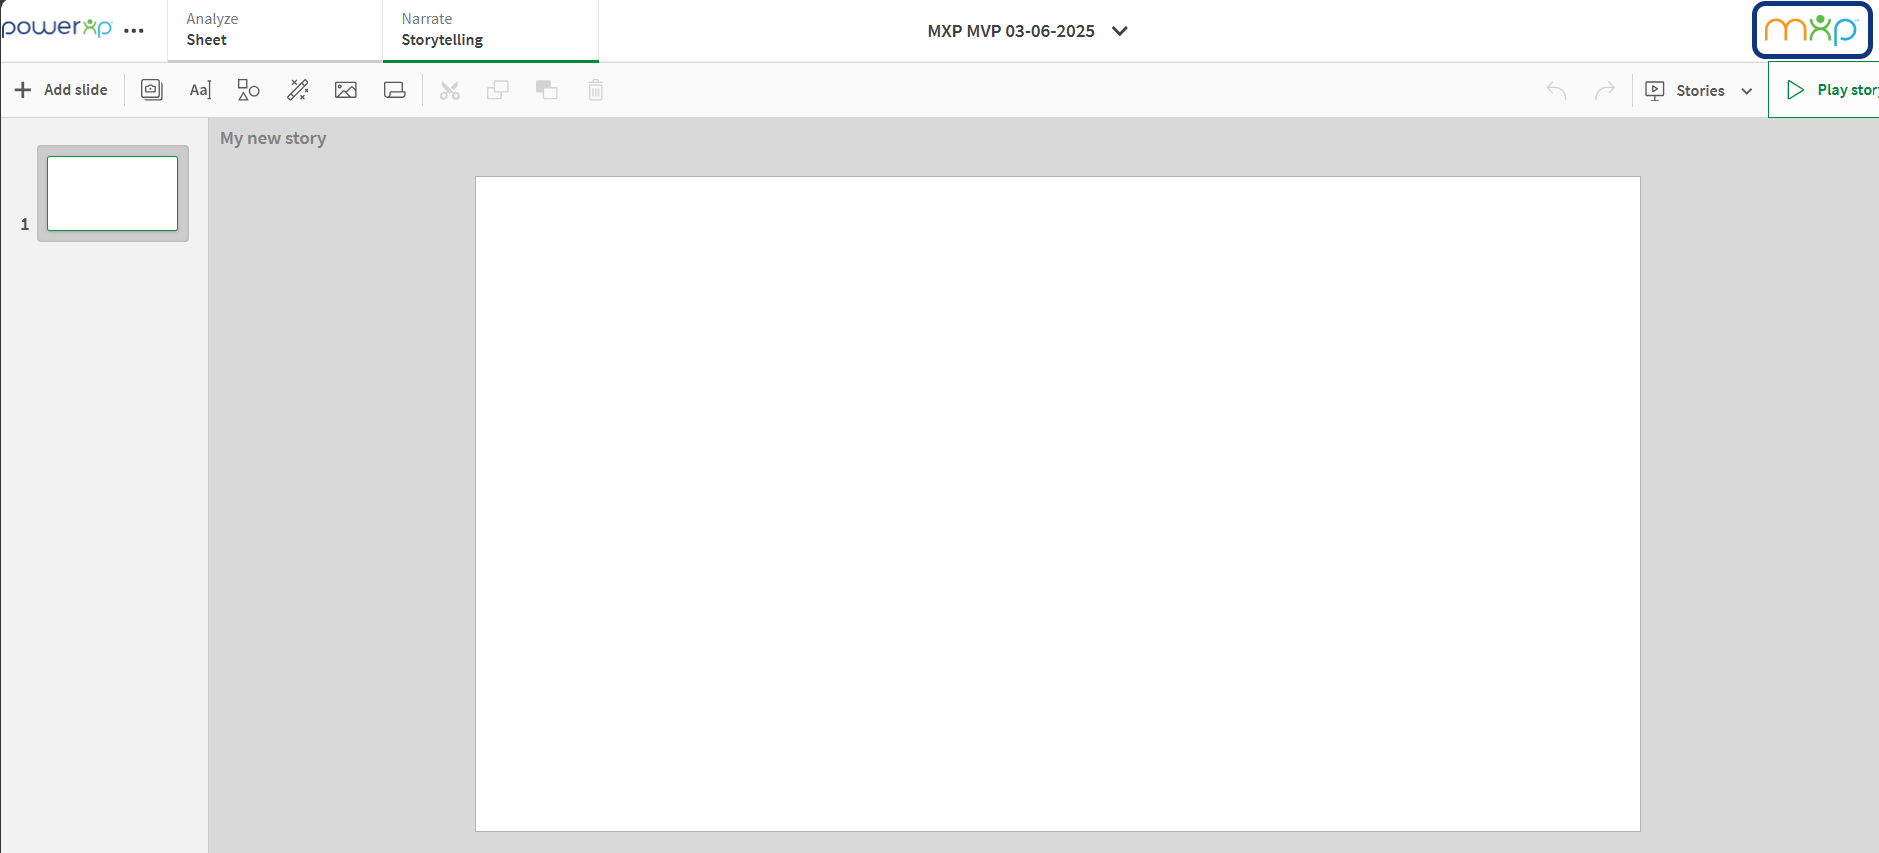
Once you have clicked the Narrate: Storytelling section, this will present you with a blank slide for your creativity to shine!
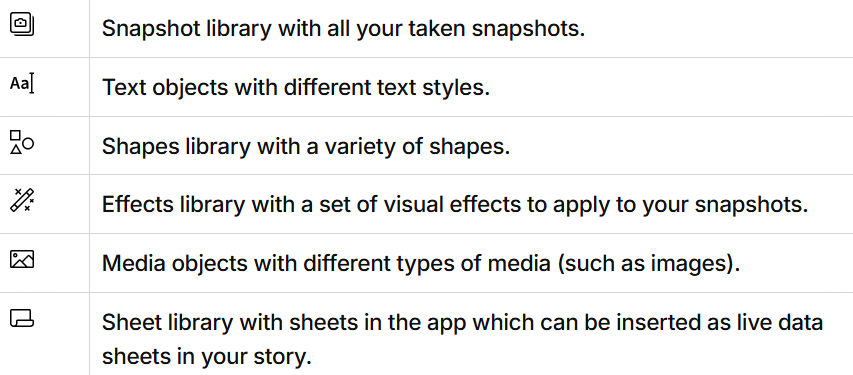
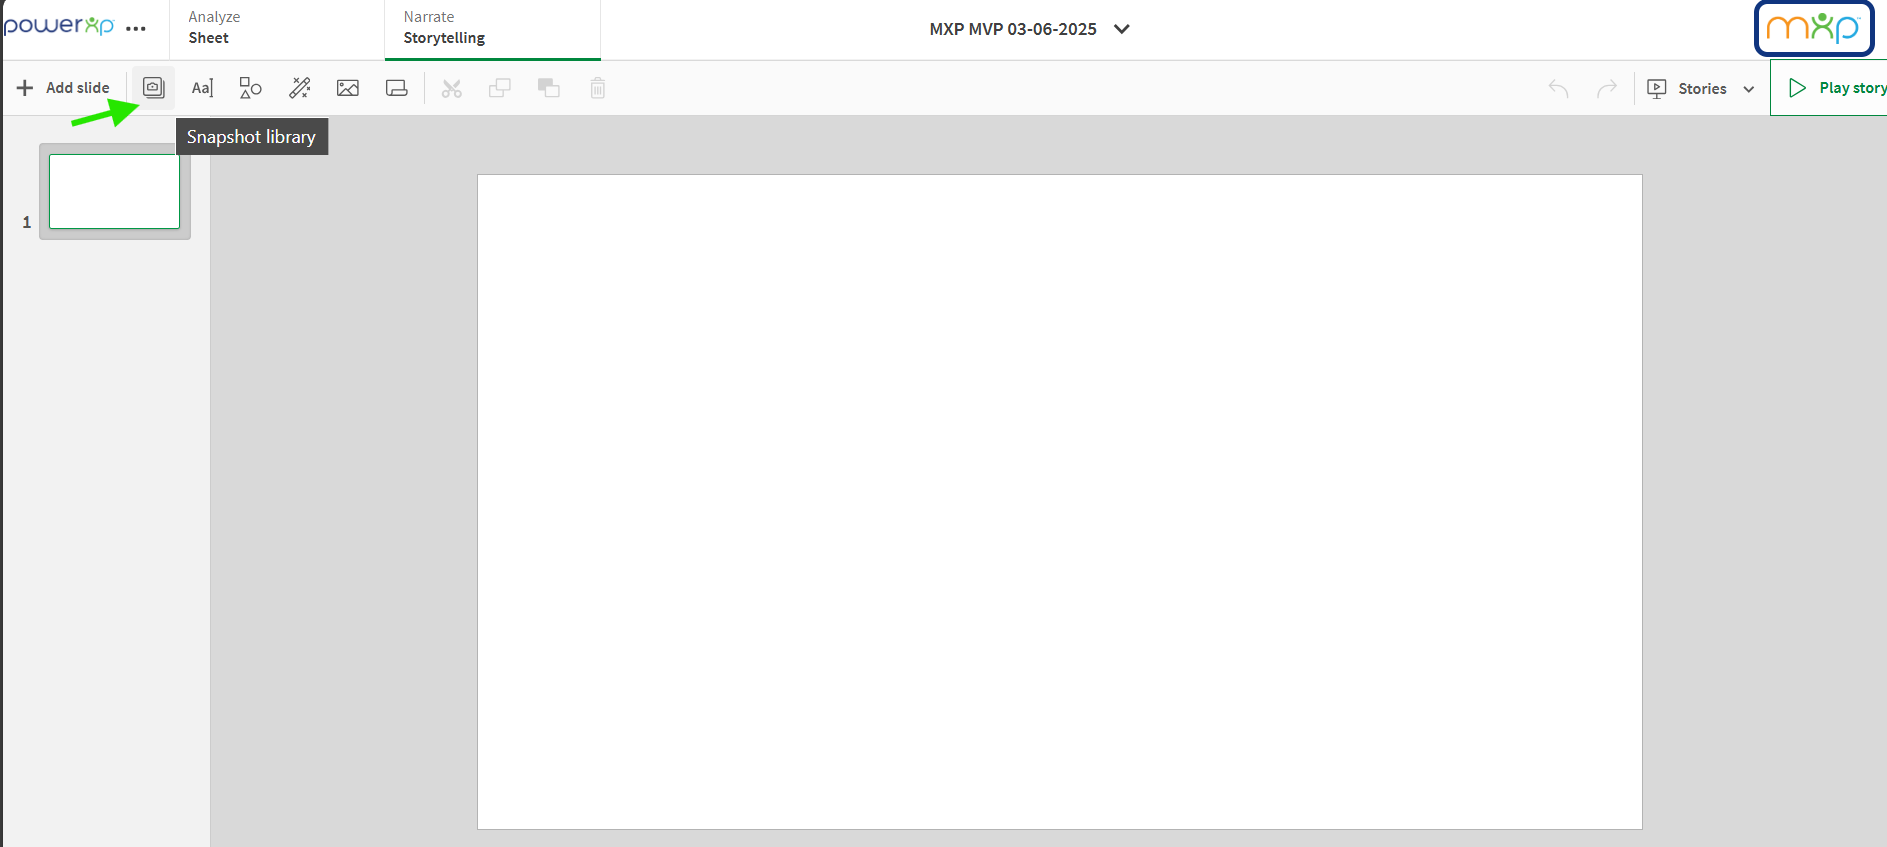
In the upper left-hand corner, next to the Add Slide button, you'll find a group of icons. Below is a description of what each icon represents and how you will be able to use these to build your story:
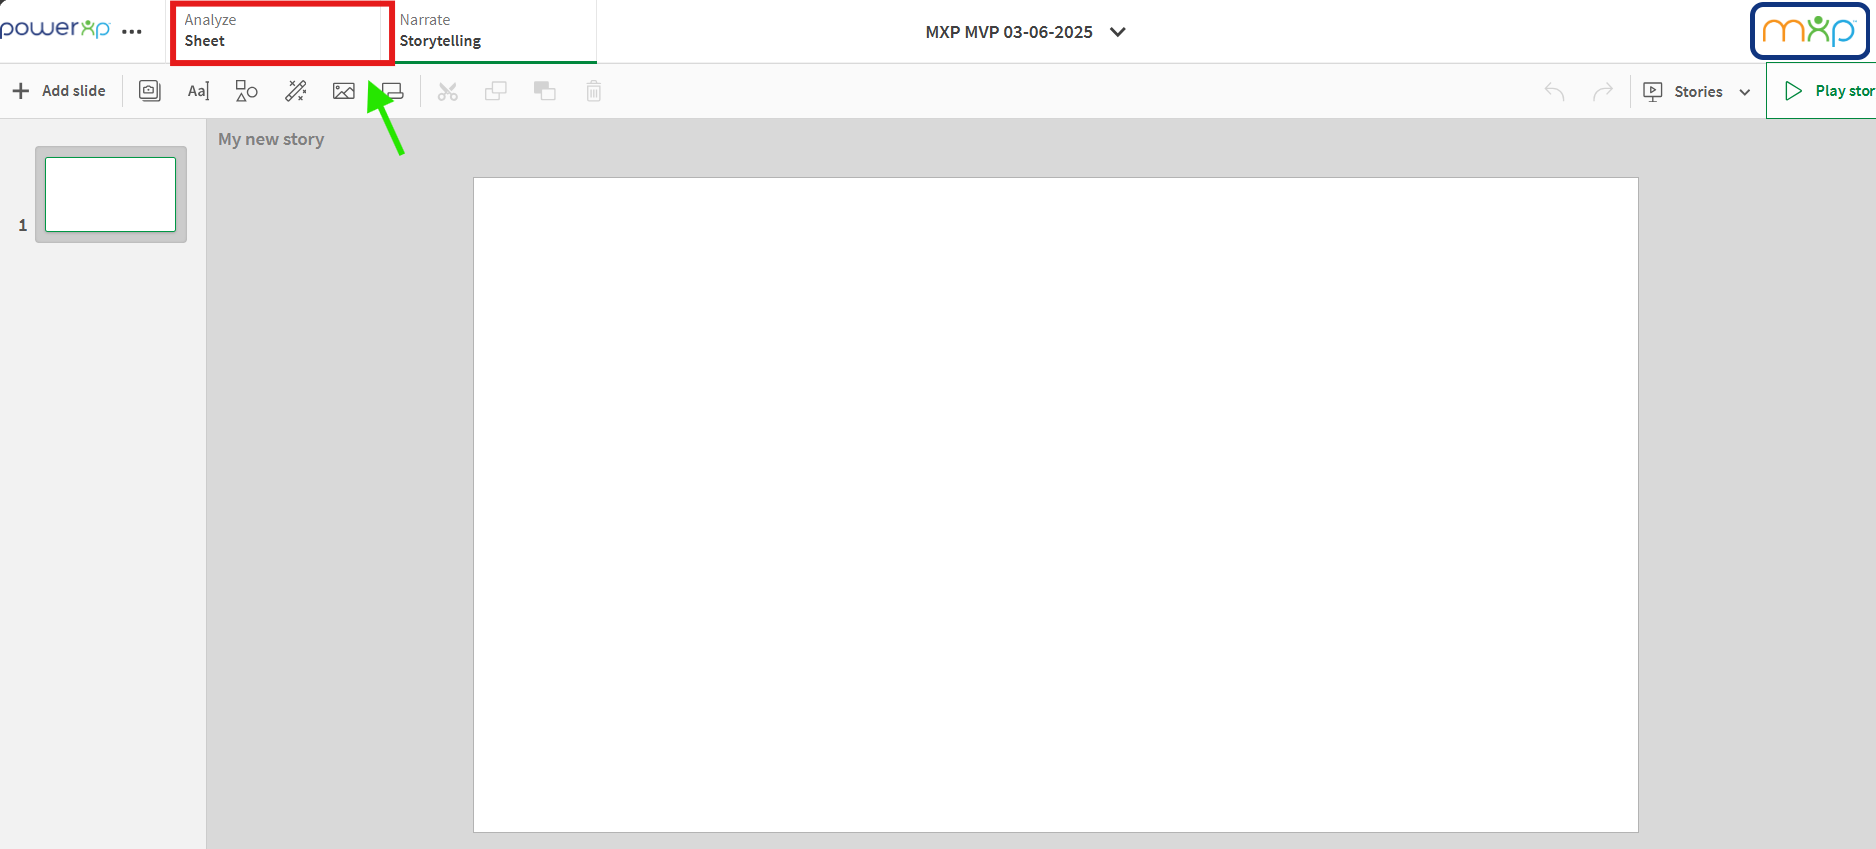
Now that know what we're getting into, let's head back and grab a few snapshots from a report within PowerXP to help build out our story (presentation). You'll just click back on the Analyze: Sheet section to head back to PowerXP's report sheets.
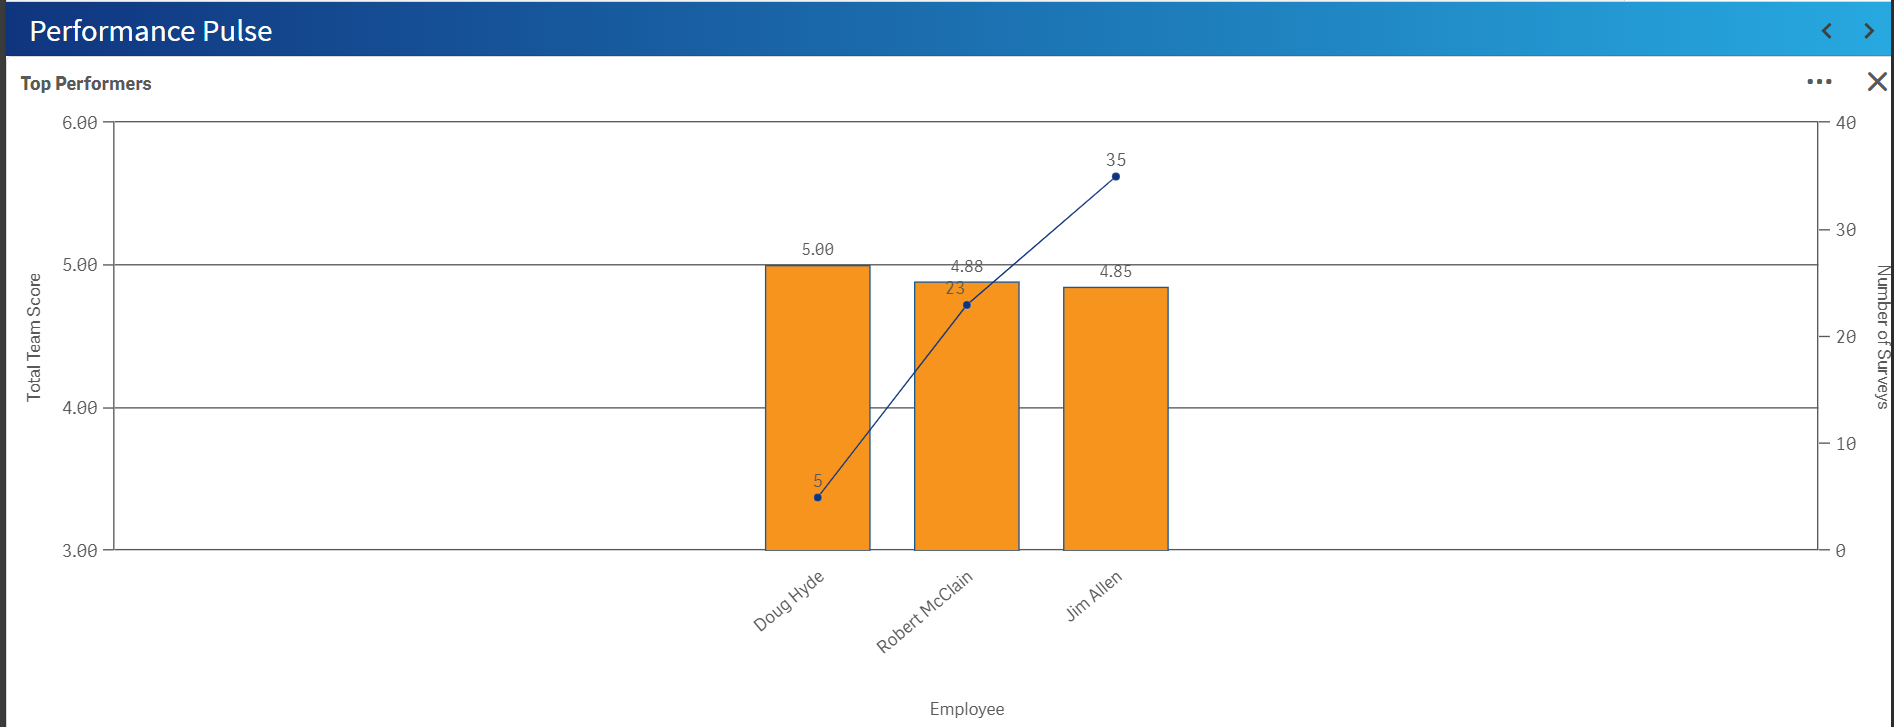
In this example, we'll head over to our Performance Pulse report which showcases how our teams and individual employees have been performing.
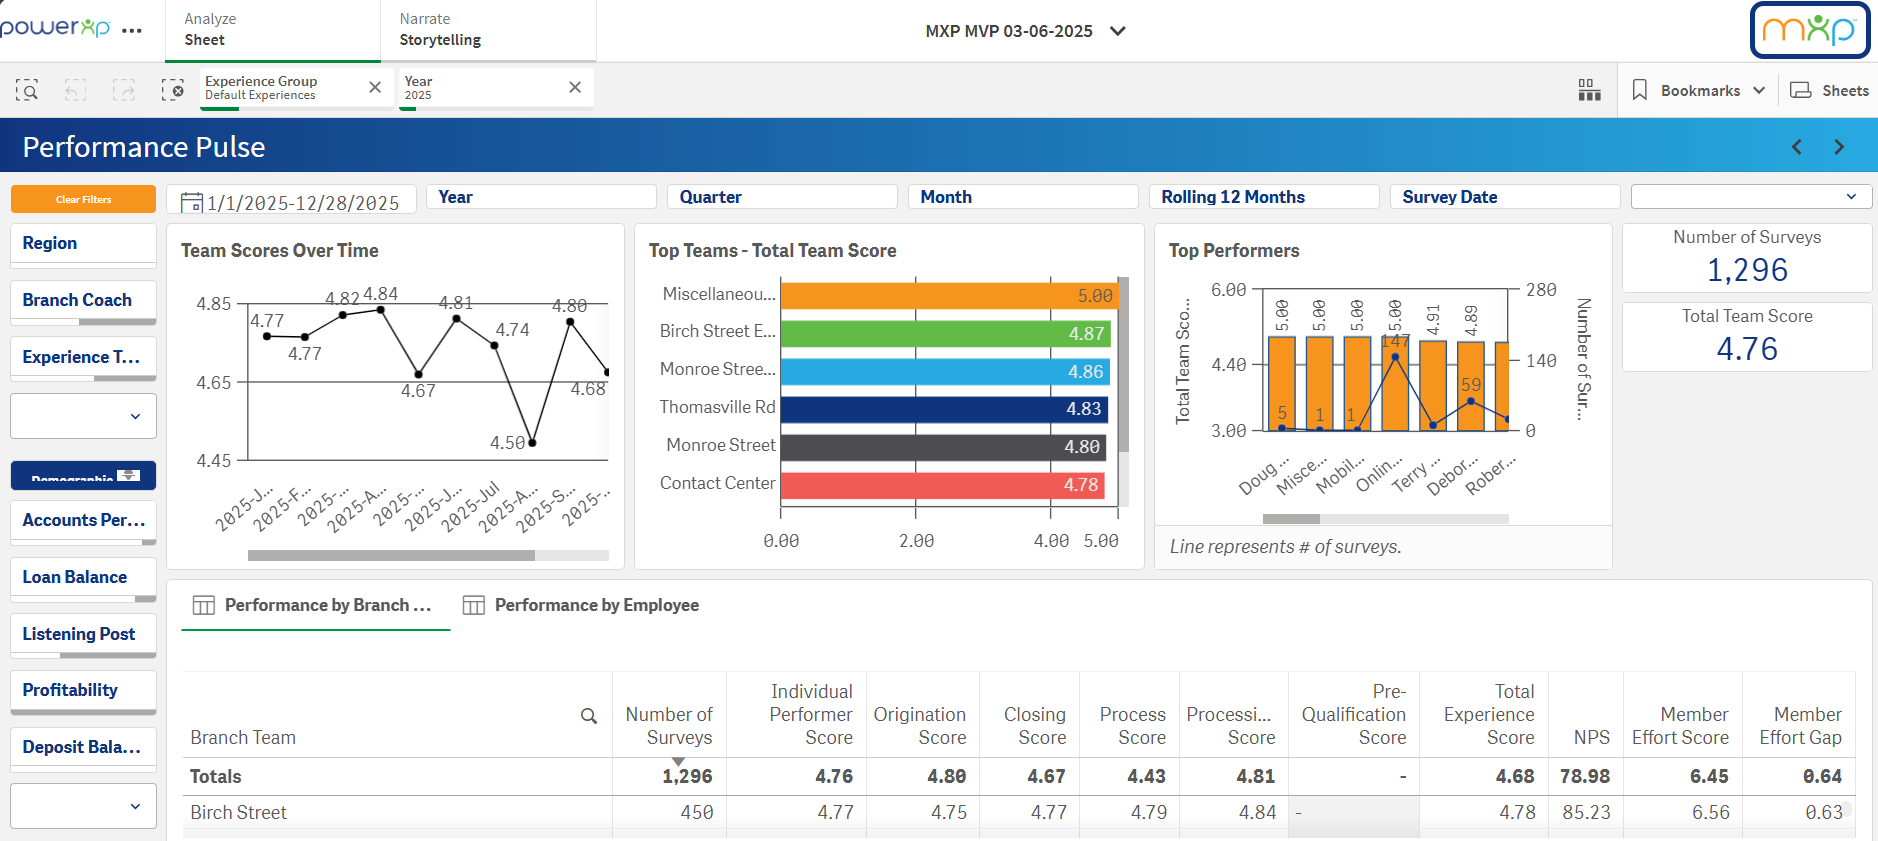
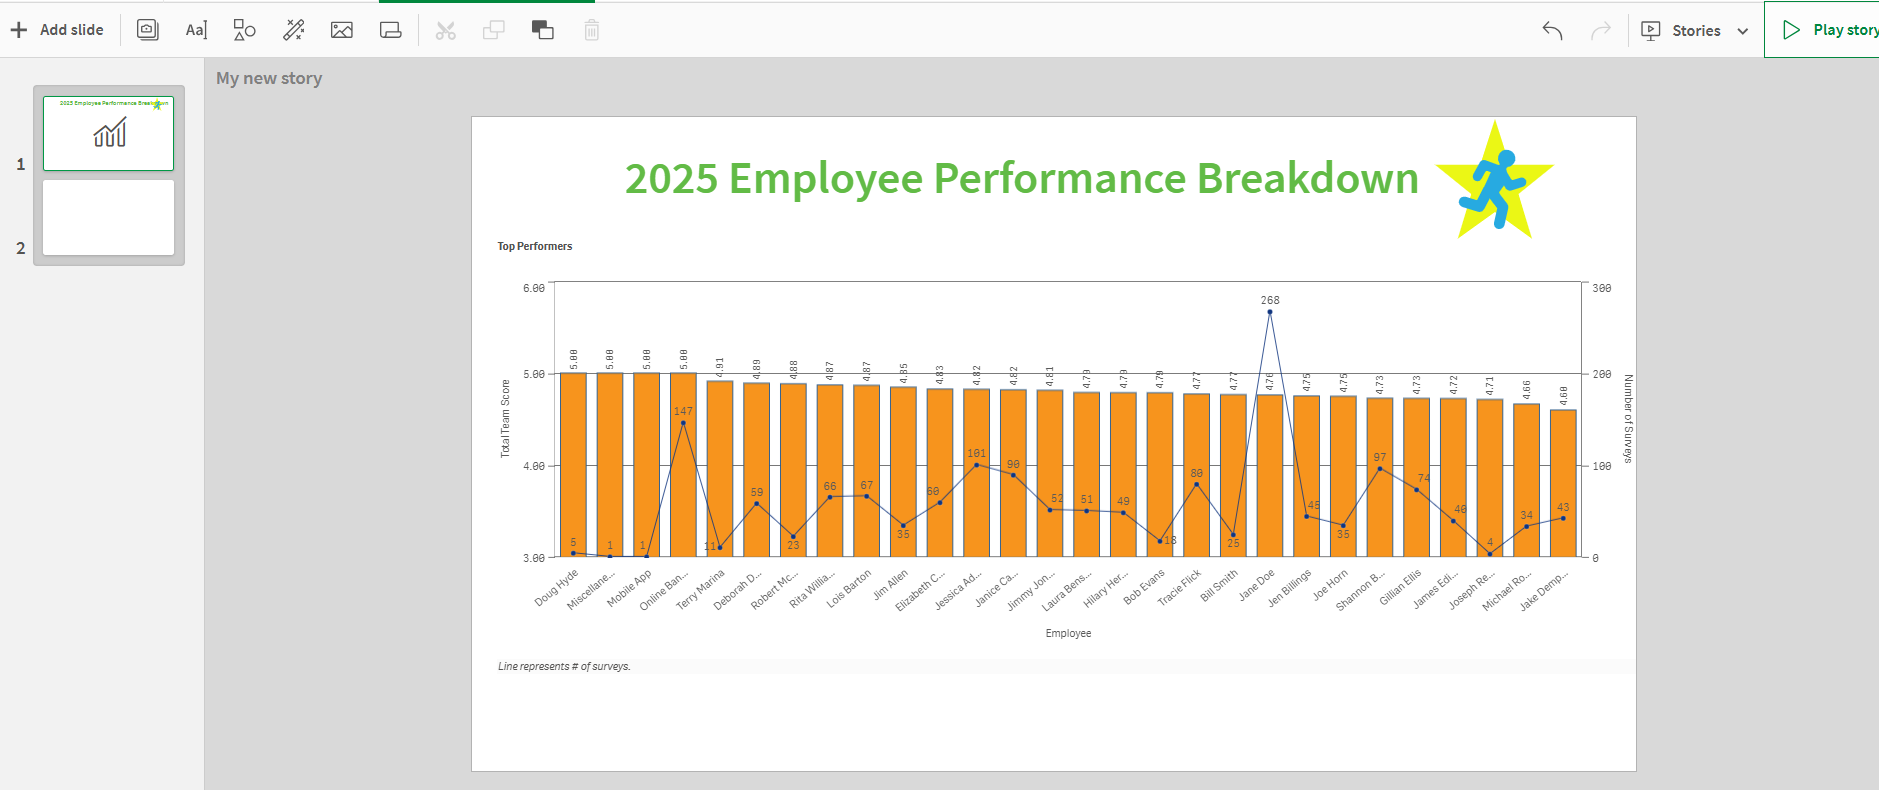
To help build out our story, right click on anything you'd like to take a snapshot of. Please do note that how a chart or graph looks when you've taken a snapshot of it is how it will appear inside of your slides.
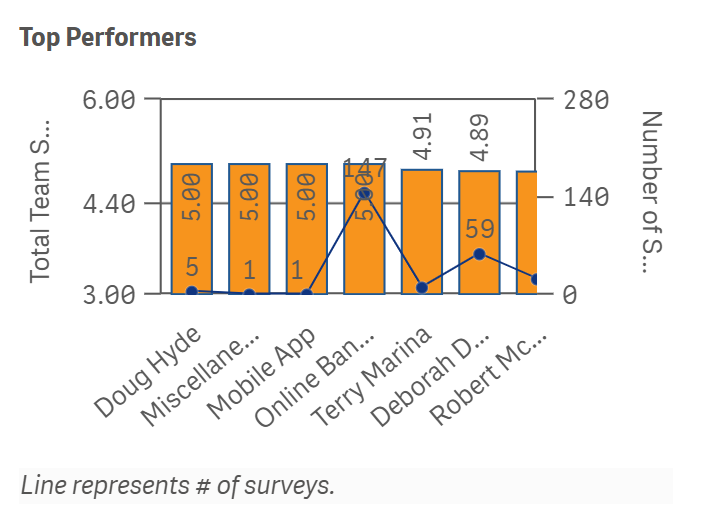
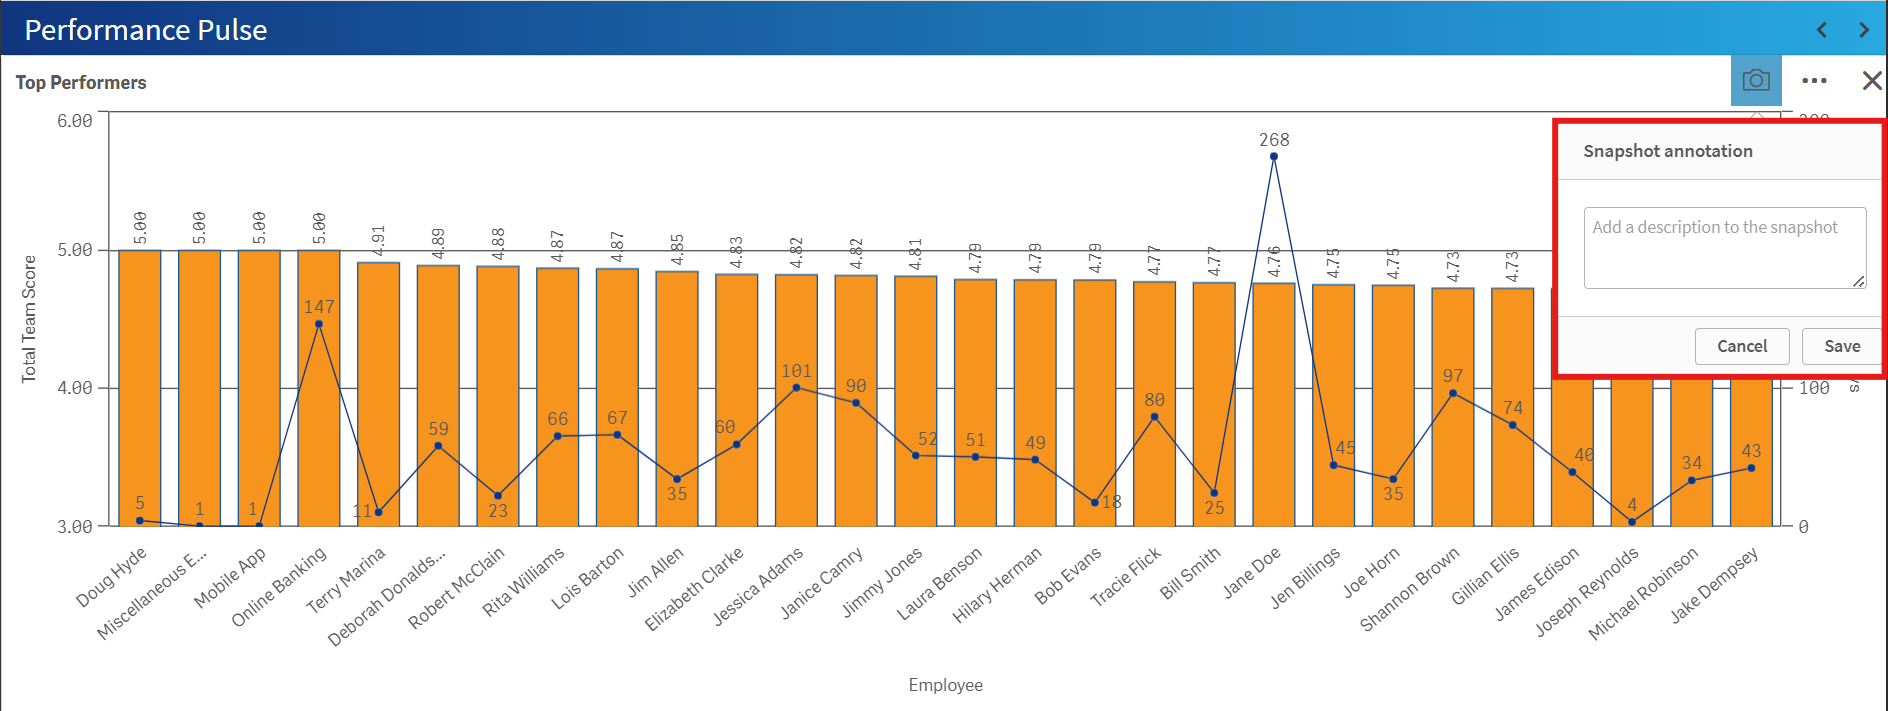
For example, if we took a snapshot of our Top Performers chart from the view above, this is how the chart will appear inside of your slides.
Some charts may need to be expanded on in order to be more presentable for a presentation and by hovering over the right-hand corner of the chart, a Full Screen icon will appear.
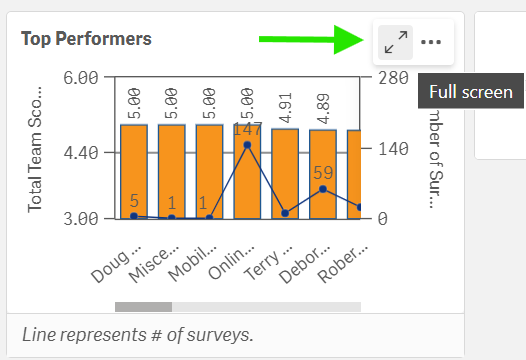
Clicking this will expand the chart and now we can take our snapshot. By right-clicking anywhere on the chart, a popup box will appear presenting you with a few different options to choose from.
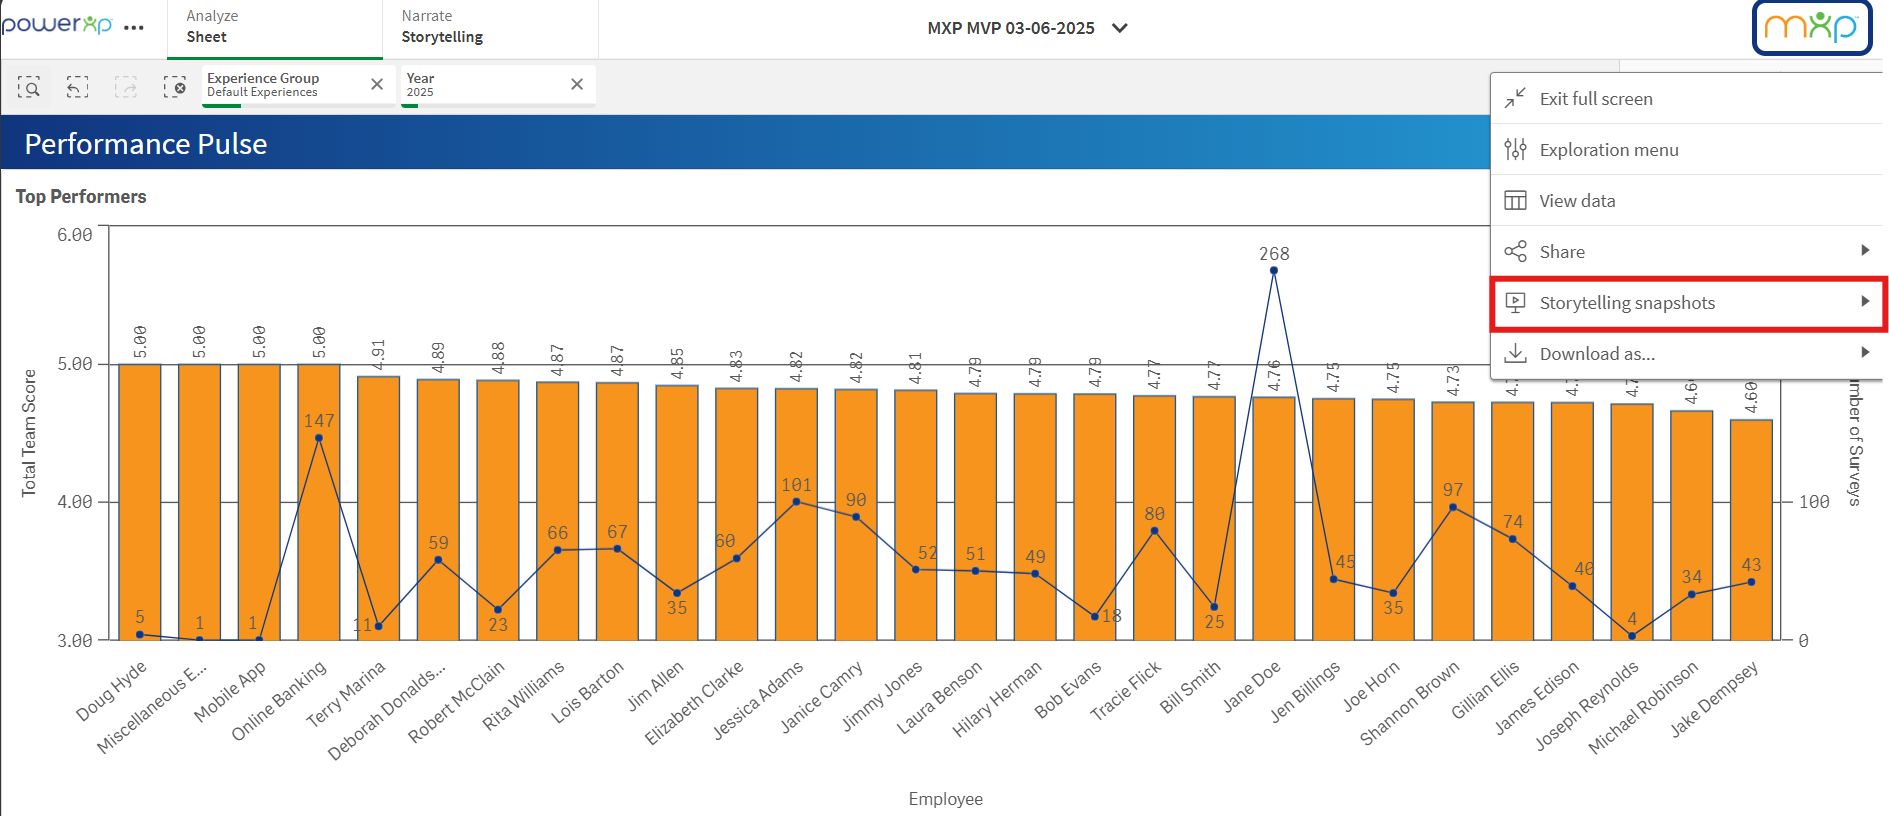
Click Storytelling Snapshots and another popup box will appear giving you the option to take a snapshot or to view what snapshots you've already taken on that specific chart or data set. We'll just elect to take a snapshot.
Once the snapshot has been taken, there will pop up another box that asks if you'd like to add an annotation. These annotations can be used for any notes you'd like to take regarding the snapshot you've taken. It is recommended to add an annotation if you are taking multiple snapshots from the same report since only the report name and the date of the snapshot will appear in your Snapshot Library. Adding in annotations will help differentiate each snapshot.
Whether you add a note or not, just hit the Save button and your screenshot will be saved to your Snapshot Library for access later.
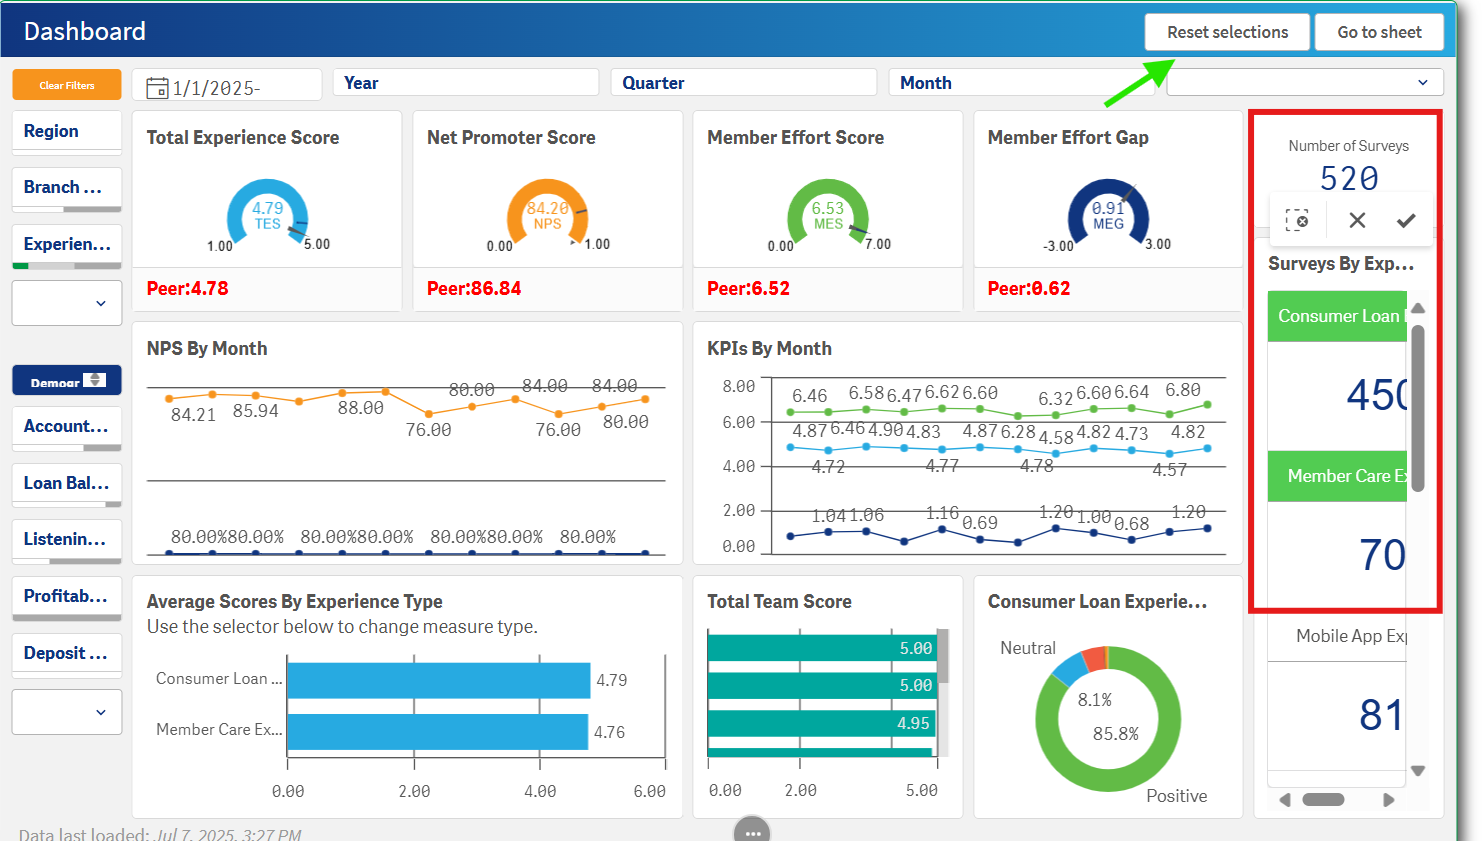
For good measure and to add to our snapshot library, let's take a few screenshots by employee by selecting each employee we want to highlight in our story.
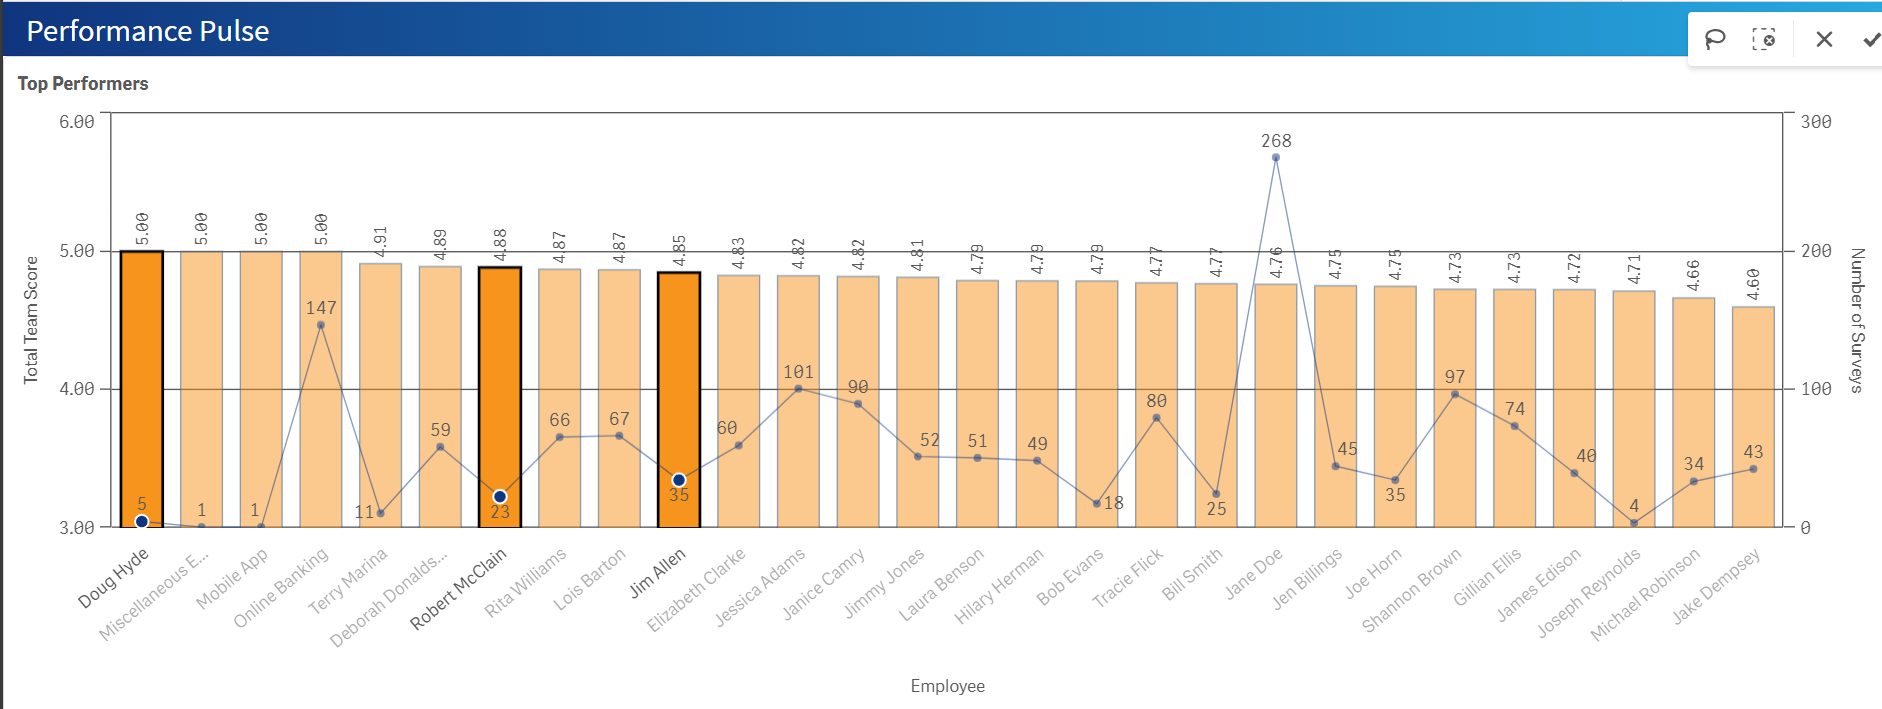
Confirm the selections by clicking on the checkmark near the upper right of the chart.
Our view should now look similar to that of the chart below:
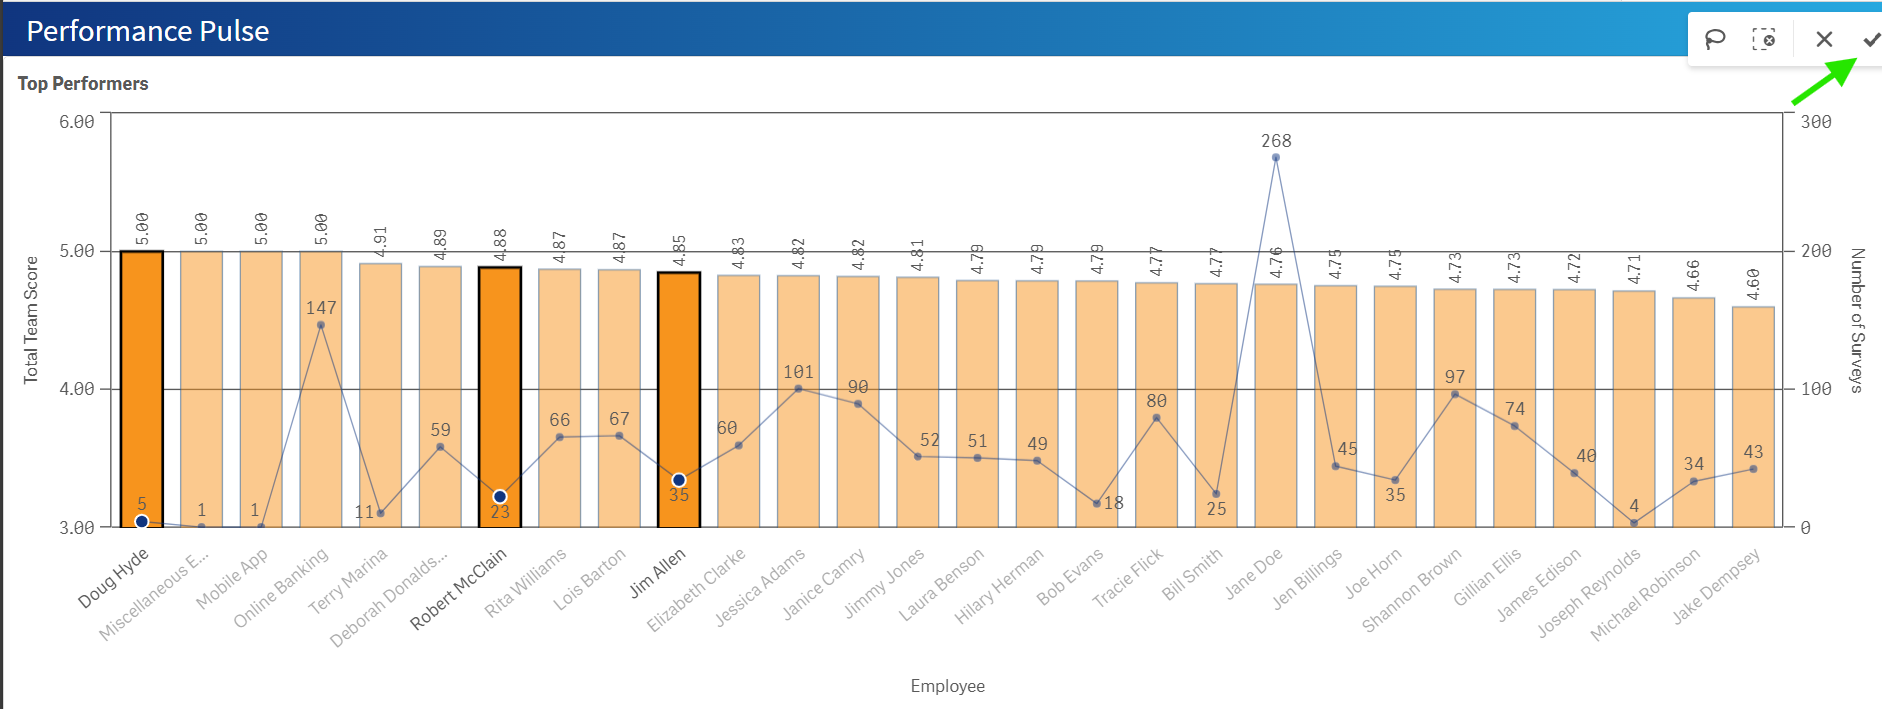
Let's once again grab a screenshot of this chart by:
- Right-clicking anywhere on the chart
- Click Storytelling Snapshots
- Take Snapshot
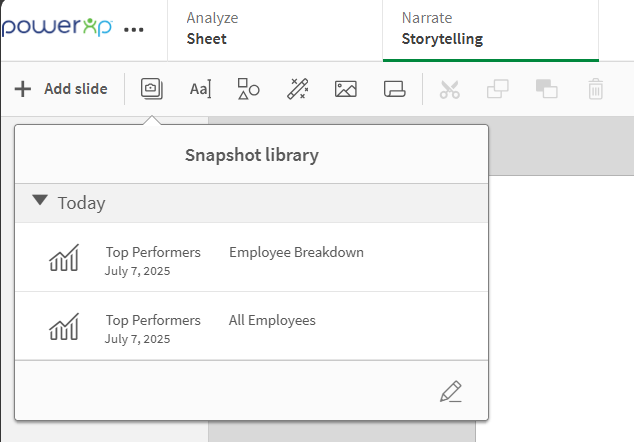
Now that we have a couple screenshots, let's apply them to our slides inside of the Storytelling section. Click the Snapshot Library icon to open up all of your available snapshots to place into your slide.
Once clicked, this will open up your past snapshots. The description of each snapshot you've taken will appear by showing you the report the snapshot had originated from as well as any annotations or notes you took to describe the snapshot (to the right).
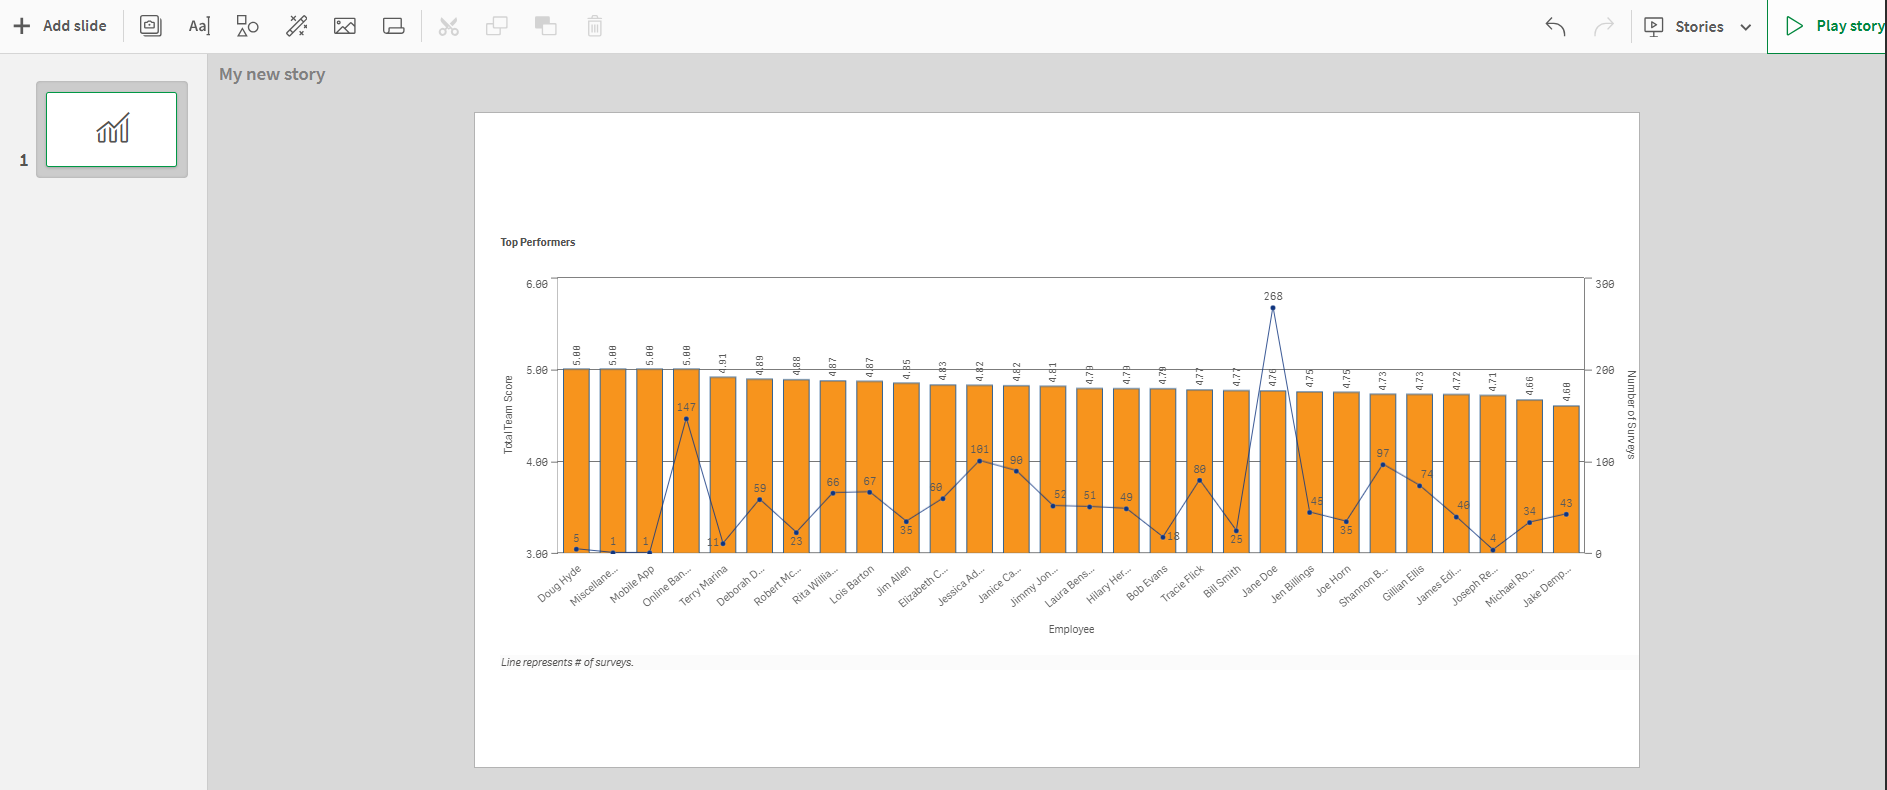
By either double-clicking or dragging the snapshot to the blank slide, the snapshot will appear and can be resized and adjusted as needed.
You can also add text boxes for summaries or titles, clip art that can spice up the visuals, or effects that help make data standout hitting on areas you'd like to be noticed or highlighted.
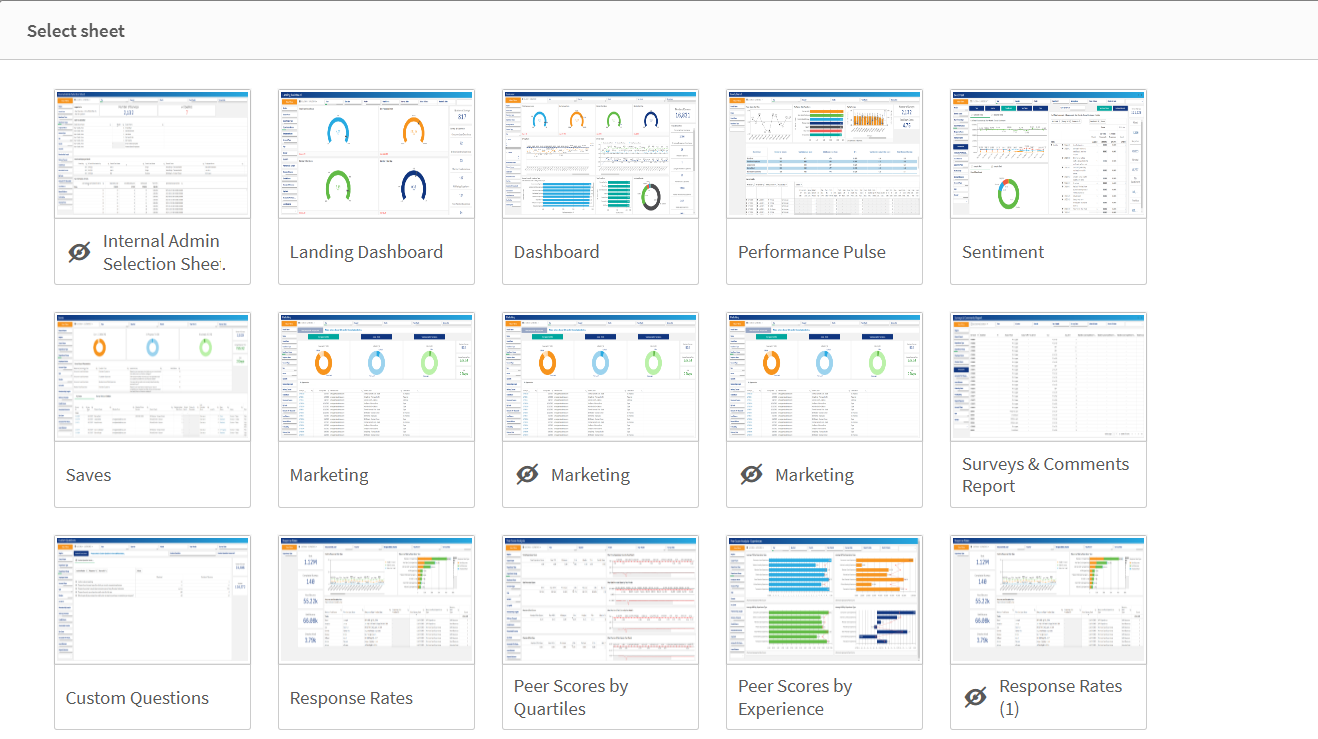
Additionally, you also have the ability to add in live data sheets inside of your story. Click the sheet icon to open up the sheet library to select a data sheet.
From here, you will be able to select the live data sheet you would like to include in your story.
Once you have added a live data sheet to your story, you can interact with the sheet just like you normally would in the Analyze: Sheet section of PowerXP. By adding filters, focusing on specific survey experience types, teams or individual employees, etc., your story becomes more interactive and lively while presenting to your audience.
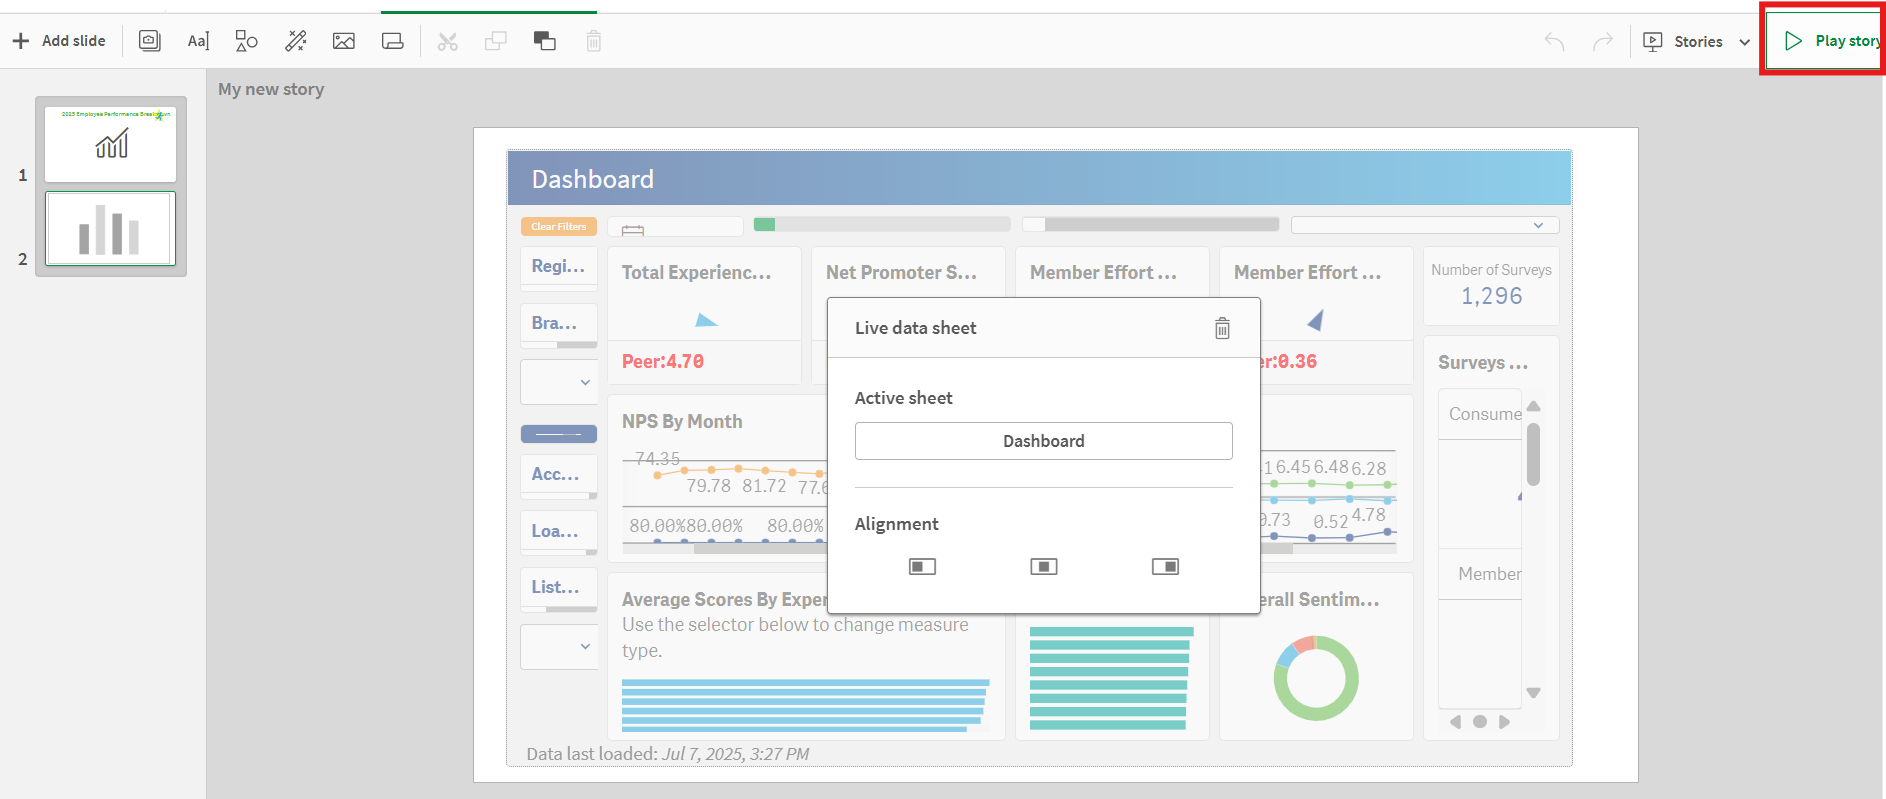
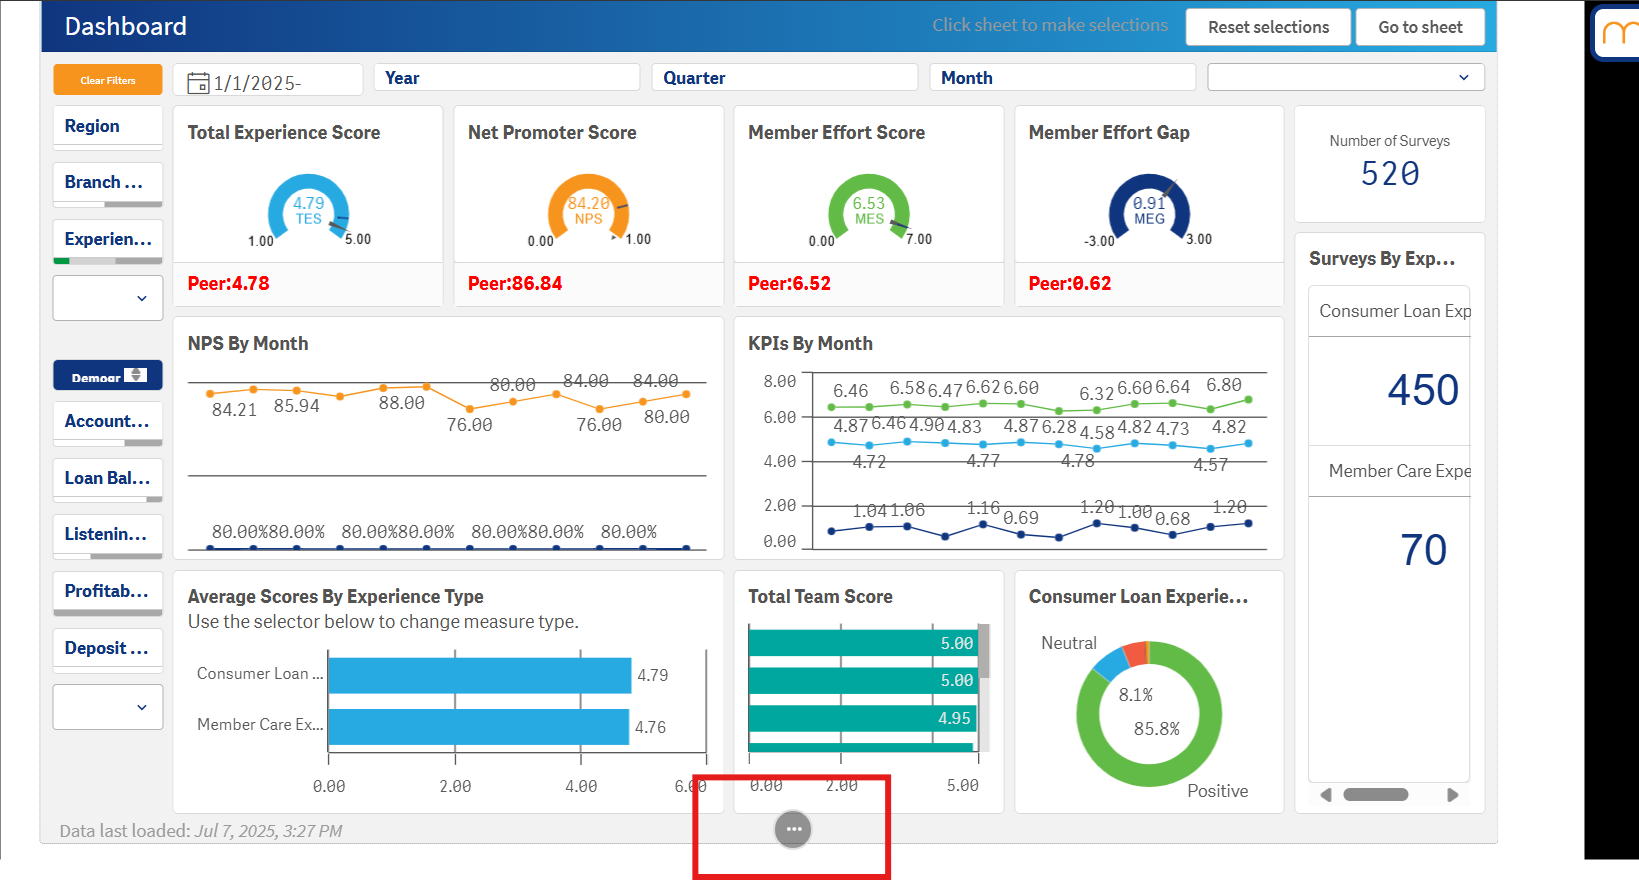
To do this, click the Play Story button in the righthand corner of the screen to open up your story (slideshow). Head to the page where the live data sheet can be found. Interact with the sheet like normal and watch it work!
You can see in the example below our total survey number has decreased from 1,296 to 520 as we applied a filter by survey experience (Consumer Loans and Member Care). If during your presentation you would like to go back to where you started originally, simply click the Reset Selections button and your data should update.
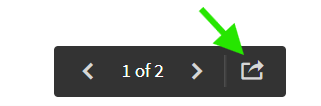
As aforementioned, you do have the ability to export your stories as PDFs or put them into PowerPoint. Simply hover towards the bottom of the slide and click on the three dots to bring up an "actions" popup box. From here, you will be able to scroll through your slides or share them by exporting.
Click here to export your story.
From here, click export after you have configured your settings and the export should begin.
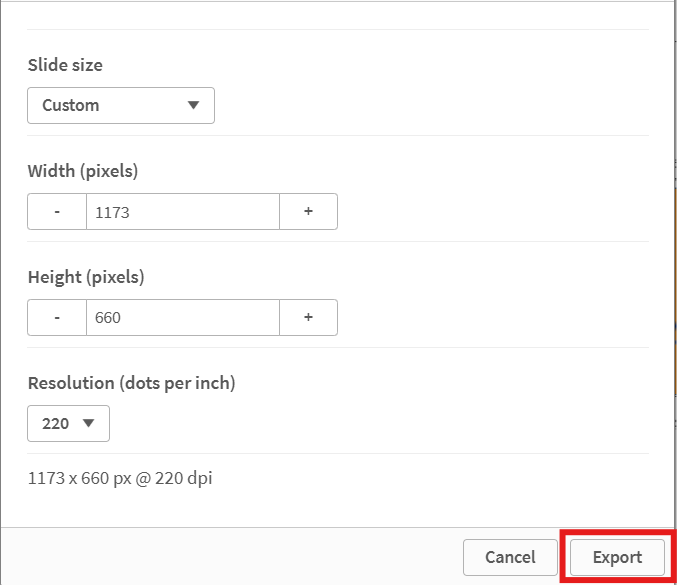
Once it has finished, blue text should appear stating you can download your export as shown below:
We can't wait to see what you create to tell your member experience story! If you should have any questions whatsoever, please reach out to your Client Success Manager or the MemberXP Help Desk.

