Report Overview
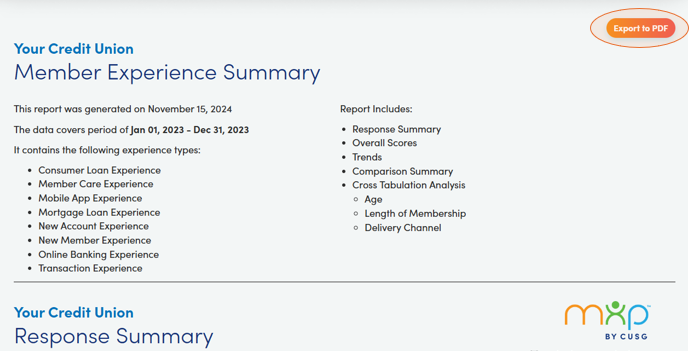
The Executive Summary report provides a high-level summary of your survey data all in one report! This report includes a response summary, overall key performance indicator (KPI) scores, KPI trends, comparisons across different survey experiences, and cross tabulation analysis for demographics including age, length of membership, and delivery channel.
It is an excellent resource to quickly and easily pull and interpret your survey results for leadership or board meetings. This report can also be exported as a PDF, making it convenient to share with your team.
Where to Access the Executive Summary Report
Within your MemberView portal, go to the 'Reports' section to access the report generator. In the 'Report Type' drop down menu, choose 'Executive Summary.' Then, select the desired date range that you wish to view, and click 'Run Report.'
Note: This report is designed to display data effectively over a 12-month period. Using shorter or longer date ranges may impact the clarity of the report.

How to Use the Executive Summary Report
Once the report is generated, you will see a summary of your survey results for your credit union overall. This summary includes the following -
Response Summary
A summary of your survey responses overall and by survey experience type. It also breaks down your responses by age, length of membership, and delivery channel to help you identify who your typical survey respondents are and the types of interactions that are included in your results.

Overall Scores
A summary of your main KPIs - Net Promoter Score (NPS), Member Effort Score (MES), and Total Experience Score (TES) - for the credit union overall.

Trends
Allows you to track month-to-month changes and identify overarching trends in your KPIs. This view provides valuable insights into performance patterns over time, helping you spot areas of improvement or consistency within your data.

Comparison Summary
Provides a visual representation of how each survey experience performs across KPIs and offers valuable insights into which experiences excel and which may require improvement.

Cross Tabulation Analysis
Provides a detailed breakdown of KPI performance across key demographics, including age, length of membership, and delivery channel. This allows for a clear comparison of how different member segments perceive your credit union, offering valuable insights into patterns and opportunities for targeted improvements.

Users can also utilize the 'Export' feature to export the Executive Summary as a PDF by clicking the 'Export to PDF' button at the top of the report. This feature is particularly useful when you wish to share the results with your team.


